LOGG Stack: The Beginning
How to install the core of the LOGG stack. With a lot of technical dive along the way.
- Introduction
- Chapter 1: Understanding the Core Components of the LOGG Stack
- Overview
- Section 1: Linux - The Foundation
- Section 2: OpenSearch - The Data Engine
- Section 3: Grafana - Visualizing Data
- Section 4: Go - The Programming Language of Choice
- Section 5: But Thats Not All - Extending the LOGG Stack
- Chapter 1 Review and Looking Ahead
- Chapter 2: Understanding and Setting Up VirtualBox
- Section 1: Introduction to VirtualBox
- Section 2: How VirtualBox Differs from Dedicated Systems like ESXi or Proxmox
- Section 3: Getting VirtualBox
- Section 4: Getting Ubuntu Linux
- Section 5: Lets Build a VM
- Section 6: Configuring the VM
- Chapter 3: Installing Linux
Introduction
Introduction to LOGG Stack: The Beginning
Welcome to LOGG Stack: The Beginning, a project deeply rooted in my extensive journey through the IT world. My career began in the late '90s, building and troubleshooting PCs at a small mom-and-pop shop. I transitioned into end-user support in the early 2000s, where I honed my skills in solving real-world problems for everyday users. As the years passed, I found myself in a more complex role, serving as a Unix admin for 14 years, where I was responsible for everything from network management to enterprise-level application development.
In 2017, I joined Elastic, where I immersed myself in the world of data analytics, search technologies, and the power of open-source solutions. After three years, I switched employers and moved into a DevOps role, further expanding my skill set and understanding of system automation and efficiency. Now, I've returned to a Layer 1 NOC environment, where I tackle everything from end-user support to network engineering.
For the last few years, I've used the LOGG stack—Linux, OpenSearch, Grafana, and Go—to solve multiple analytics challenges. Over the past nine months, in particular, this stack has proven its worth in providing real-time insights and powerful data analysis. Now, it’s time to share the power of this stack with you.
In this book, we’ll start by laying the foundation: installing and configuring the core components of the LOGG stack. But this is just the beginning. As we move forward, we’ll dive into advanced configurations, custom solutions, and a lot of cool projects along the way. Whether you’re looking to enhance your network monitoring capabilities or simply want to explore the potential of open-source tools, this book will guide you through every step of the journey.
Together, we’ll unlock the true potential of the LOGG stack and create a resource that not only meets the demands of today’s networks but also empowers you to take control of your data and infrastructure in ways you never thought possible. Let’s get started!
Chapter 1: Understanding the Core Components of the LOGG Stack
Overview
In this chapter, we'll explore the fundamental components that form the backbone of the LOGG stack: Linux, OpenSearch, Grafana, and Go. These technologies have been carefully chosen to work together, creating a powerful, flexible, and scalable system for network monitoring and analytics. Before diving into the installation and configuration, it's important to understand the role each component plays and why it was selected for this stack.
Linux serves as the stable, secure foundation, providing the operating system that supports the entire stack. Its flexibility, security, and extensive community support make it an ideal choice for running OpenSearch, Grafana, and Go applications.
OpenSearch acts as the data engine, handling the ingestion, indexing, and retrieval of large datasets. Its robust search capabilities are crucial for real-time analytics and insights, making it a key player in the stack.
Grafana is the visualization tool that brings data to life. By integrating with OpenSearch, it enables the creation of dynamic, interactive dashboards that offer clear, actionable insights into network performance and other key metrics.
Finally, Go is the programming language of choice for writing custom pollers and system utilities. Known for its efficiency and performance, Go ensures that these tools run smoothly and handle concurrent tasks effectively.
This chapter will provide a detailed look at each component, explaining their individual roles and how they combine to create a cohesive, powerful system. Understanding these elements will prepare you for the hands-on installation and configuration that follows, giving you the foundation to build and customize your own LOGG stack.
Section 1: Linux - The Foundation
Linux is the bedrock of the LOGG stack, providing a stable, secure, and versatile operating system that supports the entire infrastructure. As the foundation of the stack, Linux is not just an operating system; it's the environment in which every other component operates, ensuring that the system is reliable, performant, and adaptable to a wide range of needs.
Why Linux?
Linux has been the go-to choice for server environments for decades, and for good reason. It offers unparalleled stability, which is critical for maintaining a network monitoring and analytics system that needs to run continuously without interruption. Its open-source nature allows for complete transparency, enabling you to tailor the system to your specific needs and ensure that you're not locked into any vendor-specific solutions.
Security is another cornerstone of Linux. With a robust permissions system, extensive support for encryption, and a strong security community, Linux is well-equipped to protect your data and applications from threats. Regular updates and patches are readily available, helping you maintain a secure environment with minimal effort.
Flexibility is where Linux truly shines. Whether you're running a small network or managing a large-scale enterprise environment, Linux can be configured to meet your requirements. The variety of distributions available allows you to choose a version that fits your needs—whether it's a lightweight option like Debian or Ubuntu for general use, or a more specialized distribution tailored for network management.
Linux in the LOGG Stack
In the LOGG stack, Linux acts as the platform that supports the other components—OpenSearch, Grafana, and Go. Its ability to efficiently manage resources ensures that these applications run smoothly, even under heavy loads. Linux’s powerful networking tools, such as iptables for firewall management and netstat for monitoring network connections, are essential for ensuring that your stack operates securely and efficiently.
Moreover, Linux’s package management systems (like APT for Ubuntu) make it easy to install and manage the software required for the LOGG stack. With a few simple commands, you can set up a robust environment that includes all the necessary components, keeping them up to date with minimal manual intervention.
The command-line interface (CLI) of Linux is a powerful tool that allows for automation and scripting, which is essential for managing complex systems. Bash scripts, cron jobs, and other automation tools can be used to streamline operations, ensuring that tasks such as log rotation, data backups, and system updates are handled automatically.
Stability and Performance
One of the reasons Linux is favored in server environments is its impressive stability. Linux systems can run for years without requiring a reboot, which is crucial for maintaining uptime in a network monitoring setup. The efficient management of system resources—such as CPU, memory, and disk I/O—ensures that the LOGG stack can handle large datasets and high traffic volumes without performance degradation.
Linux’s modular design allows you to strip down the operating system to its essentials, reducing overhead and optimizing performance. This is particularly useful in a monitoring environment where you need to maximize the efficiency of your hardware to handle the demands of real-time data processing and analytics.
Security and Community Support
Security in Linux is bolstered by a strong community that regularly audits the code, provides updates, and patches vulnerabilities. Tools like SELinux (Security-Enhanced Linux) and AppArmor add additional layers of security by enforcing strict access controls. The vast repository of open-source tools available for Linux means that you can implement industry-standard security practices without incurring additional costs.
The Linux community is one of its greatest strengths. Whether you’re looking for support, documentation, or simply advice on best practices, there is a vast network of experienced professionals and enthusiasts ready to help. This community-driven support is invaluable when building and maintaining a complex system like the LOGG stack.
Practical Implementation
In the following chapters, we’ll dive into the practical aspects of setting up Linux for the LOGG stack. This will include installing the operating system, configuring the necessary packages, and setting up essential services. By the end of this section, you’ll have a solid, secure foundation on which to build the rest of the LOGG stack, ensuring that your network monitoring and analytics platform is as robust and reliable as it needs to be.
Linux is more than just the starting point for the LOGG stack—it’s the backbone that ensures everything else works in harmony. With its stability, security, and flexibility, Linux provides the ideal environment to support the advanced capabilities of OpenSearch, Grafana, and Go, enabling you to create a powerful and efficient network monitoring system.
Section 2: OpenSearch - The Data Engine
OpenSearch is a powerful, open-source search and analytics engine that plays a crucial role in the LOGG stack by handling the ingestion, indexing, and retrieval of large datasets. Originally developed as a fork of Elasticsearch, OpenSearch emerged in response to licensing changes that limited the open-source nature of Elasticsearch. The project was launched by Amazon Web Services (AWS) and has since grown with contributions from the open-source community.
A Brief History: From Elasticsearch to OpenSearch
Elasticsearch, the foundation upon which OpenSearch is built, was developed by Shay Banon and first released in 2010. It was built on top of Apache Lucene, a high-performance, full-text search engine library. Elasticsearch quickly became popular due to its scalability, flexibility, and powerful search capabilities, making it a go-to solution for log and event data analysis.
In 2021, due to licensing changes made by Elastic, AWS and the open-source community created OpenSearch by forking the last Apache 2.0-licensed version of Elasticsearch. This move was aimed at preserving the open-source nature of the project while continuing to evolve and improve the software.
What OpenSearch Does
OpenSearch excels at processing large volumes of data, enabling real-time search and analytics. It ingests data from various sources, indexes it for fast retrieval, and allows users to perform complex queries to extract insights from the data. Its capabilities include full-text search, structured search, aggregations, and real-time monitoring.
One of the key components of OpenSearch is its ability to handle diverse types of data—structured, unstructured, and semi-structured. Whether you’re dealing with logs, metrics, or any other form of data, OpenSearch can index and analyze it, providing you with actionable insights.
The Role of Lucene
At the heart of OpenSearch lies Apache Lucene, the search engine library that powers its indexing and search capabilities. Lucene is responsible for the low-level indexing and searching of documents, providing the foundation upon which OpenSearch’s powerful features are built.
Lucene’s architecture allows for efficient indexing and retrieval of documents by breaking down the data into inverted indices, which are optimized for fast search operations. This architecture enables OpenSearch to quickly scan through large datasets and return relevant results with minimal delay.
OpenSearch in the LOGG Stack
In the LOGG stack, OpenSearch serves as the central data repository and analytics engine. It handles the collection and indexing of data from various sources, allowing for efficient search and analysis. By integrating with Logstash for data ingestion and Grafana for visualization, OpenSearch enables the LOGG stack to provide a complete solution for network monitoring and analytics.
OpenSearch’s scalability is another critical factor, as it allows the system to handle growing amounts of data without sacrificing performance. This makes it an ideal choice for environments where data volumes can vary greatly over time.
Practical Implementation
In the upcoming chapters, we’ll explore how to install and configure OpenSearch as part of the LOGG stack. We’ll cover the basic setup, followed by advanced configurations that allow you to tailor the system to your specific needs. By the end of this section, you’ll have a fully functioning OpenSearch instance, ready to index and analyze the data flowing through your network.
Understanding OpenSearch is crucial for leveraging the full potential of the LOGG stack. It’s not just a tool for searching; it’s a powerful engine that turns raw data into actionable insights, making it an indispensable component of modern network monitoring systems.
Section 3: Grafana - Visualizing Data
Grafana is an open-source analytics and interactive visualization web application that serves as a vital component of the LOGG stack. Known for its flexibility and rich features, Grafana enables users to create dynamic dashboards and graphs that provide real-time insights into data stored in various databases, including OpenSearch.
What Grafana Does
Grafana’s primary function is to visualize data, turning raw metrics into actionable insights through interactive dashboards. It supports a wide range of data sources, making it incredibly versatile for various monitoring and analytics use cases. Whether you’re tracking network performance, system health, or application metrics, Grafana provides the tools to visualize data in a meaningful way.
Grafana’s strength lies in its ability to create customized dashboards with a wide array of visualization options, including time-series graphs, heatmaps, tables, and more. Users can interact with these dashboards, applying filters, zooming in on specific data ranges, and combining multiple data sources into a single cohesive view.
Grafana in the LOGG Stack
In the LOGG stack, Grafana plays the crucial role of making complex data accessible and understandable. While OpenSearch handles data ingestion and indexing, Grafana allows you to visualize this data, creating a powerful combination for monitoring and analytics.
By connecting Grafana to OpenSearch, you can create real-time dashboards that display everything from network latency and packet loss to server performance metrics. This visual layer makes it easier to identify trends, spot anomalies, and make informed decisions based on the data.
Grafana also offers alerting capabilities, allowing you to set up custom alerts based on specific thresholds or conditions. These alerts can notify you of potential issues in your network or system, enabling proactive management and minimizing downtime.
Flexibility and Integration
One of Grafana’s key advantages is its flexibility. It integrates with a wide variety of data sources beyond OpenSearch, including Prometheus, InfluxDB, MySQL, and more. This makes Grafana a central hub for visualizing data across your entire infrastructure, not just within the confines of the LOGG stack.
Grafana also supports a wide range of plugins, allowing you to extend its functionality with additional visualization options, data sources, and custom panels. This extensibility ensures that Grafana can adapt to your specific needs, whether you’re monitoring network health, application performance, or business metrics.
Practical Implementation
In the following chapters, we’ll guide you through the process of installing and configuring Grafana, connecting it to OpenSearch, and building your first dashboards. We’ll explore various visualization techniques, how to create effective alerts, and how to customize Grafana to suit your specific requirements.
By the end of this section, you’ll have a deep understanding of how to use Grafana to visualize and interpret the data collected by your LOGG stack. This will enable you to gain valuable insights into your network and system performance, empowering you to make data-driven decisions with confidence.
Grafana transforms raw data into intuitive, actionable visuals, making it an indispensable tool in the LOGG stack. With its robust feature set and flexibility, Grafana helps bridge the gap between data collection and analysis, turning your data into a strategic asset.
Section 4: Go - The Programming Language of Choice
Go, also known as Golang, is a statically typed, compiled programming language designed by Google. In the context of the LOGG stack, Go serves as the backbone for writing custom pollers, system utilities, and other automation tools that ensure efficient data collection and management. Its simplicity, performance, and concurrency support make it an ideal choice for handling tasks that require speed and reliability.
Why Go?
Go was created with simplicity and efficiency in mind, addressing some of the challenges that developers faced with languages like C and Java. One of the key reasons Go was chosen for the LOGG stack is its ability to handle concurrent tasks with ease, thanks to its lightweight goroutines. This makes it perfect for writing pollers that need to manage multiple data streams simultaneously without sacrificing performance.
Go is also known for its fast compilation times and minimal runtime dependencies, which means that programs written in Go are easy to deploy and run on various systems. Its garbage collection and memory management features reduce the risk of memory leaks and other issues that can plague long-running applications, making it a reliable choice for network monitoring tasks.
Go in the LOGG Stack
Within the LOGG stack, Go plays a critical role in enhancing the functionality of OpenSearch, Grafana, and other components. By using Go to develop custom pollers, you can efficiently gather data from network devices, servers, and other sources, feeding this data into OpenSearch for indexing and analysis. These pollers can be tailored to your specific needs, ensuring that the LOGG stack is optimized for your environment.
Go's performance also shines when it comes to processing large volumes of data in real-time. Whether you're monitoring network traffic, system metrics, or other types of data, Go's ability to handle concurrent processes ensures that your monitoring system remains responsive and accurate.
Practical Implementation
In upcoming chapters, we'll delve into how to set up a Go development environment and write your first Go-based poller. We'll cover everything from the basics of Go programming to advanced techniques for handling concurrency and optimizing performance. You'll also learn how to integrate these pollers with the rest of the LOGG stack, ensuring seamless data flow and efficient monitoring.
By the end of this section, you'll have a solid understanding of Go and its role in the LOGG stack. You'll be equipped to write custom tools that enhance your network monitoring capabilities, giving you greater control over your data and infrastructure.
Go is more than just a programming language in the LOGG stack; it's a powerful tool that allows you to extend and customize your system to meet your specific needs. Its efficiency, simplicity, and concurrency capabilities make it the perfect choice for handling the demands of modern network monitoring and analytics.
Section 5: But Thats Not All - Extending the LOGG Stack
While the core of the LOGG stack is built on Linux, OpenSearch, Grafana, and Go, the power of this stack comes from its ability to integrate with other open-source tools that enhance its capabilities. One such tool is Logstash, a flexible data processing pipeline that ingests, transforms, and forwards data from various sources to OpenSearch.
Why Logstash?
Logstash is a highly versatile data processing tool that can handle data from a variety of sources, including logs, metrics, and more. Its strength lies in its ability to parse, filter, and enrich data before it reaches OpenSearch, ensuring that your data is well-organized and meaningful by the time you analyze it. Logstash’s ability to handle complex data transformations makes it an invaluable component in environments where data comes from diverse and dynamic sources.
Logstash in the LOGG Stack
In the LOGG stack, Logstash plays a crucial role in managing the flow of data between your network and OpenSearch. By configuring Logstash with various input, filter, and output plugins, you can process raw data into structured formats that OpenSearch can index efficiently. This includes tasks like parsing log files, enriching data with additional context, or filtering out unnecessary information.
Logstash also offers flexibility in handling different data formats and protocols, making it easier to integrate with other systems and applications within your infrastructure. Whether you’re dealing with syslog data, JSON logs, or custom application metrics, Logstash can be configured to process it all seamlessly.
Beyond the Core: Other Tools and Technologies
While Logstash is a key component, the LOGG stack is designed to be adaptable, incorporating other tools and technologies as needed. For instance, Perl and Ruby can be employed for specific tasks that require scripting or quick data manipulations. These languages are powerful for writing custom scripts that can preprocess data, automate tasks, or interface with APIs.
The flexibility of the LOGG stack means that you can integrate any tool that meets your specific needs. Whether it’s a small utility script or a full-fledged application, the stack’s open-source nature ensures that you can extend and customize it without limitations.
Practical Implementation
So, in the following chapters, we will also explore how to set up and configure Logstash to work with OpenSearch and other components of the LOGG stack. You’ll learn how to create pipelines that ingest data from various sources, apply transformations, and forward the results to OpenSearch for indexing. We’ll also cover how to use additional tools like Perl and Ruby when specific tasks require more tailored solutions.
By the end of this section, you’ll have the knowledge to effectively manage data flows within your LOGG stack, ensuring that your data is not only collected but also processed and stored in a way that maximizes its value.
Logstash, along with other complementary tools, adds significant power and flexibility to the LOGG stack. By embracing these additional components, you can build a truly comprehensive monitoring and analytics platform that’s capable of handling the diverse and complex needs of modern IT environments.
Chapter 1 Review and Looking Ahead
In this chapter, we’ve explored the core components of the LOGG stack: Linux, OpenSearch, Grafana, Go, and Logstash. Each of these tools plays a vital role in creating a powerful, customizable network monitoring and analytics platform. We’ve delved into why each component was chosen, how they work together, and the flexibility they bring to the table.
As we move forward, we’ll get hands-on with installing and configuring these components, starting with setting up the Linux environment. From there, we’ll build out the stack, integrating each tool and exploring advanced customizations to meet the specific needs of your network. Future chapters will guide you through creating custom pollers, visualizing data in real-time, and leveraging the full power of open-source technology. Stay tuned as we transform this foundation into a dynamic, fully-functional monitoring system.
Chapter 2: Understanding and Setting Up VirtualBox
Understanding VirtualBox.
Section 1: Introduction to VirtualBox
2.1. What is VirtualBox?
VirtualBox is an open-source virtualization software developed by Oracle that allows you to run multiple operating systems simultaneously on a single physical machine. It creates a virtual environment where you can install and operate a guest operating system as if it were a separate physical machine. This environment is isolated from your main operating system, providing a safe space to experiment with different configurations, software, and setups without affecting your host system.
Overview of VirtualBox as a Virtualization Tool
VirtualBox operates by simulating the hardware that an operating system would normally run on. When you create a virtual machine (VM) within VirtualBox, it allocates a portion of your system's resources, such as CPU, memory, and storage, to the VM. The guest operating system running on this VM believes it is working on a real machine, while in reality, it's running within the confines of the virtual environment provided by VirtualBox.
Key Features and Benefits of Using VirtualBox for Development and Testing
-
Cross-Platform Compatibility:
- VirtualBox is compatible with a wide range of host operating systems, including Windows, macOS, Linux, and Solaris. This flexibility makes it an ideal choice for developers working in diverse environments.
-
Support for Multiple Guest OSes:
- You can install and run various operating systems as guests on VirtualBox, including different versions of Linux, Windows, and BSD. This is particularly useful for testing software in different OS environments or learning new systems without needing additional hardware.
-
Snapshot and Restore:
- VirtualBox allows you to take snapshots of a VM at any point in time. If something goes wrong during testing or development, you can easily revert to a previous snapshot, saving time and effort in setting up the environment again.
-
Isolation and Safety:
- Since VMs are isolated from the host system, any changes made within the VM do not affect the host OS. This isolation provides a secure environment for testing potentially unstable or risky configurations, software, or code.
-
Resource Management:
- VirtualBox allows you to control the amount of resources allocated to each VM, such as CPU cores, memory, and disk space. This helps in optimizing performance while ensuring that the host system remains responsive.
-
Networking Flexibility:
- VirtualBox offers various networking modes (e.g., NAT, Bridged, Host-Only) that allow VMs to interact with each other, with the host, or with external networks. This makes it ideal for simulating network environments and testing networking configurations.
-
Open Source and Community Support:
- As an open-source tool, VirtualBox is free to use and benefits from a large community of users and contributors. This means frequent updates, a wealth of tutorials, and a strong support network to help troubleshoot issues.
-
Ease of Use:
- VirtualBox features a user-friendly interface that makes it easy to create and manage virtual machines, even for those who are new to virtualization.
By providing a flexible, safe, and efficient environment, VirtualBox becomes an essential tool for developers, system administrators, and IT professionals. Whether you're testing new software, learning about different operating systems, or setting up isolated environments for development, VirtualBox offers a powerful solution to meet your needs.
Section 2: How VirtualBox Differs from Dedicated Systems like ESXi or Proxmox
When diving into virtualization, it’s important to understand the different options out there and why we might choose one over the other. VirtualBox, for instance, is quite different from dedicated systems like ESXi or Proxmox. Let’s break down those differences and explain why VirtualBox is a great starting point for this project.
Key Differences Between VirtualBox and Dedicated Systems:
-
Hypervisor Type:
- VirtualBox (Type 2 Hypervisor):
- VirtualBox runs on top of your existing operating system, whether it’s Windows, macOS, or Linux. This makes it easy to get started without making any changes to your hardware setup.
- ESXi and Proxmox (Type 1 Hypervisors):
- On the other hand, ESXi and Proxmox are what we call type 1 hypervisors. They run directly on the physical hardware, without needing a host OS in between. This setup can offer better performance, but it’s a bit more complex to set up and manage.
- VirtualBox (Type 2 Hypervisor):
-
Performance:
- VirtualBox:
- Because VirtualBox runs on top of another operating system, there’s a little bit of overhead, which can mean slightly lower performance. But for development, testing, or smaller projects, this isn’t usually a big issue.
- ESXi and Proxmox:
- These systems are designed for performance. They have direct access to the hardware, which can be crucial in a production environment where you need every bit of power and efficiency.
- VirtualBox:
-
Resource Management:
- VirtualBox:
- VirtualBox shares your computer’s resources with the host OS, so there’s a bit of give and take. It’s perfect for projects where you don’t need to squeeze every last drop of performance out of your hardware.
- ESXi and Proxmox:
- These platforms let you manage resources more efficiently, directly from the hardware. They’re built to handle heavy loads and multiple VMs in large-scale environments.
- VirtualBox:
-
Scalability:
- VirtualBox:
- VirtualBox is really handy for smaller setups or when you’re just getting started. However, it might feel a bit limited if you try to manage a large number of VMs.
- ESXi and Proxmox:
- These systems are designed to scale. If you’re running a data center or managing dozens of VMs, they offer the tools you need to keep everything running smoothly.
- VirtualBox:
-
Features and Functionality:
- VirtualBox:
- VirtualBox covers the basics very well. It’s got everything you need to create, manage, and experiment with VMs, making it a great tool for learning and development.
- ESXi and Proxmox:
- If you need advanced features like clustering, high availability, or live migration of VMs, that’s where ESXi and Proxmox shine. They’re packed with enterprise-grade features that go beyond what VirtualBox offers.
- VirtualBox:
-
Ease of Use:
- VirtualBox:
- One of the biggest reasons we’re using VirtualBox for this project is its simplicity. It’s very user-friendly, making it accessible to a wide audience, even if you’re new to virtualization.
- ESXi and Proxmox:
- These platforms are powerful, but they also come with a steeper learning curve. They’re great for IT professionals who need robust tools for managing complex environments.
- VirtualBox:
-
Use Cases:
- VirtualBox:
- VirtualBox is ideal for anyone who needs to set up a quick, isolated environment for development, testing, or learning. It’s flexible and doesn’t require any special hardware.
- ESXi and Proxmox:
- These systems are often used in larger, more critical environments. They’re the go-to choice for production servers, large-scale deployments, and when uptime and reliability are paramount.
- VirtualBox:
-
Cost:
- VirtualBox:
- VirtualBox is free and open-source, which is another reason we’re using it. You can get started without worrying about licensing costs or subscriptions.
- ESXi and Proxmox:
- ESXi has a free version, but the full feature set requires a license, which can be expensive. Proxmox is also open-source, with an optional subscription for support, making it a bit more accessible but still more complex than VirtualBox.
- VirtualBox:
Why We Chose VirtualBox
For this project, we’ve chosen VirtualBox because it’s more accessible to a wider audience. Whether you’re a seasoned IT professional or just getting your feet wet with virtualization, VirtualBox offers a simple, straightforward way to dive in without the complexity or cost of more advanced systems. It’s perfect for experimenting, learning, and building a solid foundation before moving on to more complex setups like ESXi or Proxmox if needed.
In the next steps, we’ll walk through setting up your first virtual machine in VirtualBox, which will serve as the base for building our LOGG stack.
Section 3: Getting VirtualBox
VirtualBox is a well-established virtualization tool that has been around since 2007, when it was first released by Innotek GmbH. Over the years, it has become one of the most popular and widely used virtualization platforms, thanks to its combination of robust features, ease of use, and, importantly, its open-source nature. In 2010, Oracle acquired VirtualBox, continuing to develop and support it, making it a reliable choice for both personal and professional use.
One of the most appealing aspects of VirtualBox is its cross-platform compatibility. Whether you're running Windows, macOS, Linux, or even Solaris, VirtualBox will work seamlessly on your system. This means you can follow along with this project no matter what kind of workstation you're using, making it accessible to a wide audience.
To get started with VirtualBox, you'll need to download it from the official VirtualBox website. Here’s the link: Download VirtualBox.
Once you're on the site, choose the download option that matches your operating system. VirtualBox offers straightforward installation packages for different platforms, so just select the one that fits your setup.
Installation Instructions:
-
For Windows Users:
- Download the Windows installer from the link above.
- Run the installer and follow the prompts. The default settings work fine for most users.
- After the installation is complete, you can launch VirtualBox from the Start menu or desktop shortcut.
-
For macOS Users:
- Download the macOS installer (.dmg file) from the VirtualBox website.
- Open the downloaded file and drag the VirtualBox icon to your Applications folder.
- You might need to allow the installation from System Preferences under Security & Privacy, especially if your system is configured to only allow apps from the App Store.
-
For Linux Users:
- Most Linux distributions include VirtualBox in their repositories. You can install it using your package manager, or download the latest version directly from the VirtualBox website.
- For example, on Ubuntu, you can use the following commands in the terminal:
-
sudo apt update
sudo apt install virtualbox
-
- If you're downloading it from the website, follow the provided instructions for your specific distribution.
After installing VirtualBox, you'll be ready to create your first virtual machine and begin exploring the LOGG stack setup. The beauty of VirtualBox is that you can do this on almost any workstation, regardless of the operating system, making it an incredibly versatile tool for learning and development.
Section 4: Getting Ubuntu Linux
When choosing an operating system for our virtual machine, I selected Ubuntu for several reasons. Ubuntu has been my Linux server of choice for over a decade due to its reliability, stability, and ease of use. It provides a secure and efficient environment, making it ideal for a wide range of server applications. Additionally, Ubuntu’s strong community support and comprehensive documentation ensure that you have access to the tools and resources you need.
To get started, you'll need to download the Ubuntu Server ISO file. You can find the latest version of Ubuntu Server at the following link:
Once you've downloaded the ISO file, I recommend saving it in an organized location on your computer. Consider creating a dedicated folder for operating system ISOs, such as OS_ISOs, where you can store this and any future ISO files. This will help keep your files organized and easily accessible for future use.
Once you have the ISO downloaded we are ready to move on to setting up Virtualbox and getting the LOGG stack on the road.
Section 5: Lets Build a VM
Why Are We Building a VM?
A virtual machine (VM) is essentially a computer within your computer, running on top of your existing operating system. It allows you to create an isolated environment where you can install and run different operating systems and software without affecting your main system. For our LOGG stack project, using a VM gives us the flexibility to experiment and configure each component in a controlled space. It’s like having a sandbox where you can build, test, and tweak your setup without any risk to your primary machine. By allocating specific resources like CPU, memory, and storage, we ensure that the VM can efficiently handle the tasks we'll throw at it, all while keeping your main system free from potential conflicts.
Lets Get Started
At this point, you should have VirtualBox installed on your system. Upon launching the application, you will be presented with an interface similar to the one shown below. If you are already familiar with VirtualBox, you can proceed with the following steps. Our goal is to create a virtual machine configured with 4 processor cores, 4GB of RAM, and 40GB of hard drive space.
To get started, here we will click new. Which will present you with the screen below.

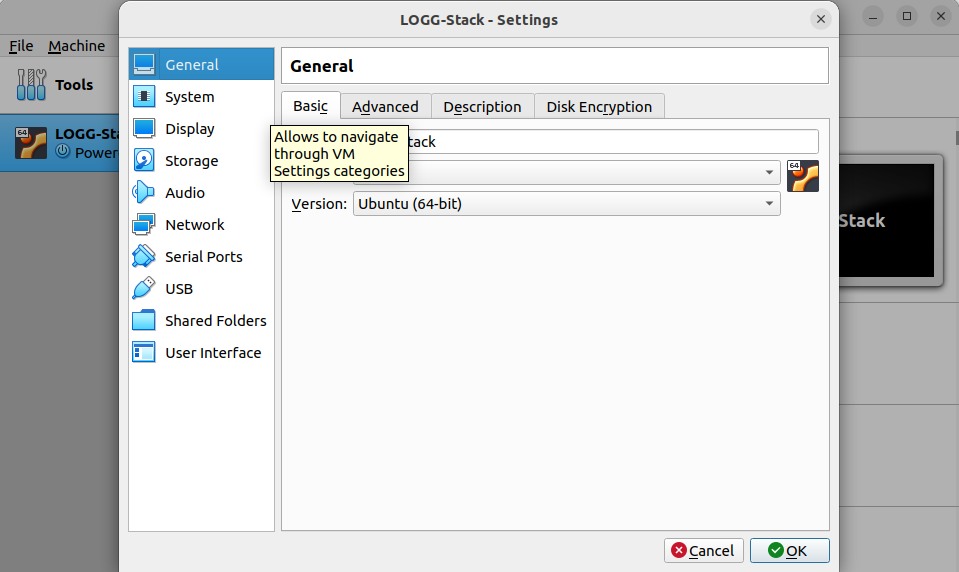
Let's begin by configuring our virtual machine. For this project, we'll name the VM LOGG-Stack. In the Machine Folder field, set the directory to LOGG-Stack-VM to keep your files organized. In the Type dropdown menu, select Linux, and in the Version dropdown, choose Ubuntu (64-bit). Next, set the memory allocation to 4096 MB (which is roughly 4 GB of RAM). You can either type this value directly or use the slider to adjust it. Once these settings are correctly configured, the setup screen should resemble the one shown below.
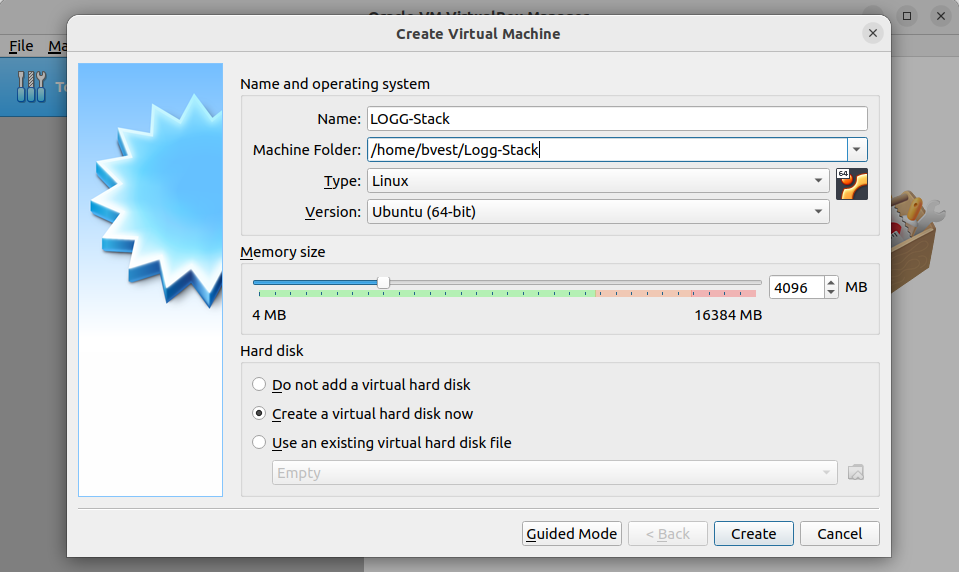
When you have all of this setup click the Create button and lets move on to the next steps.
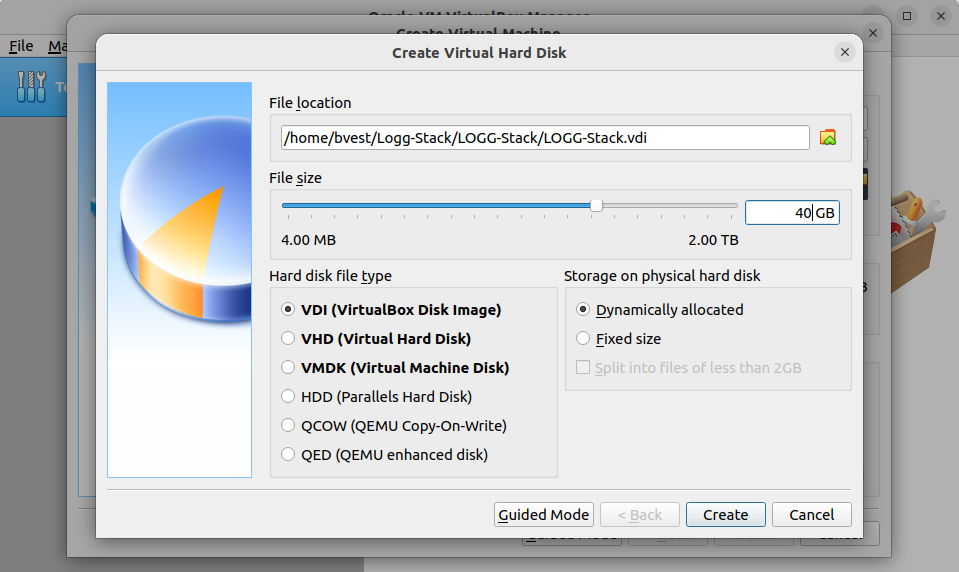
After clicking "Create," you will be directed to the virtual hard disk creation screen. This screen presents several options, most of which can be left at their default settings. However, it's important to allocate more space for this VM than the default 10GB. To do this, either type in 40GB or use the slider to adjust the disk size accordingly, as shown below.
Once you click "Create," the setup process will complete fairly quickly, and you'll be returned to the main VirtualBox interface. You should now see our newly created VM, LOGG-Stack, listed and ready for launch. The setup process is straightforward, and your virtual machine is now prepared for the next steps in our project.
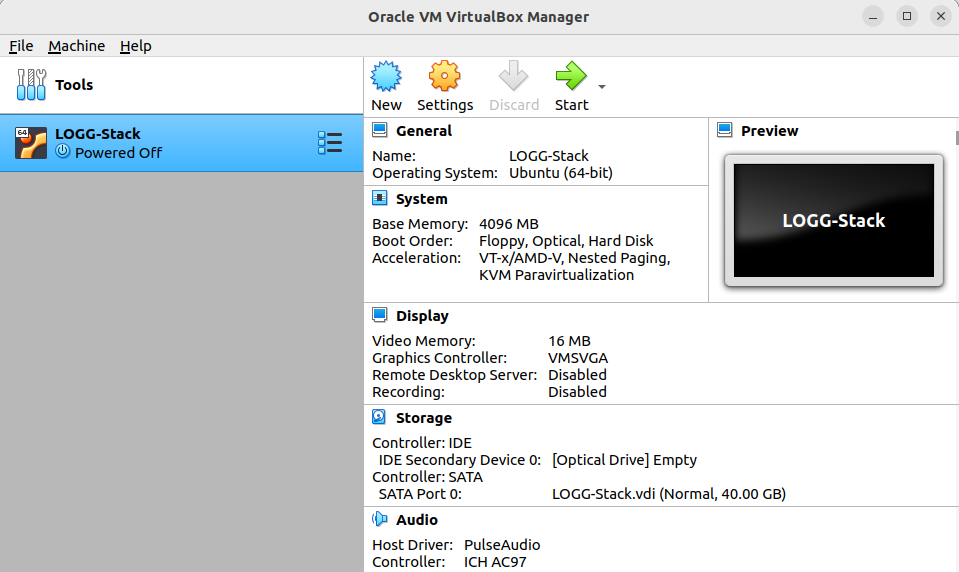
Although our virtual machine is now set up, we're not quite ready to launch it just yet. Before we proceed, it's important to configure the VM to ensure it meets the specific requirements for our project. Let's move on to Section 6, where we'll walk through the configuration steps necessary to optimize the VM.
Section 6: Configuring the VM
Introduction
While the initial setup guides us through the basic process of building our virtual machine, there are a couple of additional adjustments we need to make to ensure it’s configured correctly for our project. Specifically, we need to adjust the number of CPU cores allocated to the VM and mount the ISO file that will install our operating system. These steps are crucial to optimizing performance and preparing the environment for the tasks ahead. Let's dive into these configurations to get our VM fully ready for use.
Why Do We need This?
Configuring the VM with 4 processors and 4096 MB of memory is a critical step to ensure the LOGG stack performs optimally. In data processing tasks like these, having more CPU cores or threads is often more important than raw processor speed. This is because the stack’s components, particularly OpenSearch and Logstash, are designed to handle large volumes of data by parallelizing tasks across multiple cores.
OpenSearch and Logstash are both built on Java, which manages memory through the Java Virtual Machine (JVM). JVM-based applications benefit from multiple cores as they can distribute processing loads across threads, improving performance and responsiveness. However, they also require sufficient memory to manage data efficiently. OpenSearch uses memory to store index data and query results, while Logstash needs memory to buffer and process logs in real-time. With only 4 cores, your system will be able to manage basic tasks, but as data loads increase, these resources may become a bottleneck. Understanding this allows you to anticipate the system’s behavior and plan for potential upgrades as your data processing needs grow.
And then there's Linux—the trusty OS that’s about to become the backbone of our entire operation. Remember that big ISO we downloaded earlier? Yep, it’s finally time to put it to work. Linux is like the dependable engine under the hood; it quietly powers everything we do, from managing resources to keeping our stack running smoothly. Without it, our processors and memory would be sitting idle, and our entire setup would be more of a concept than a functioning system. So yes, we definitely need it, and it’s about to earn its keep.
Lets Get Started
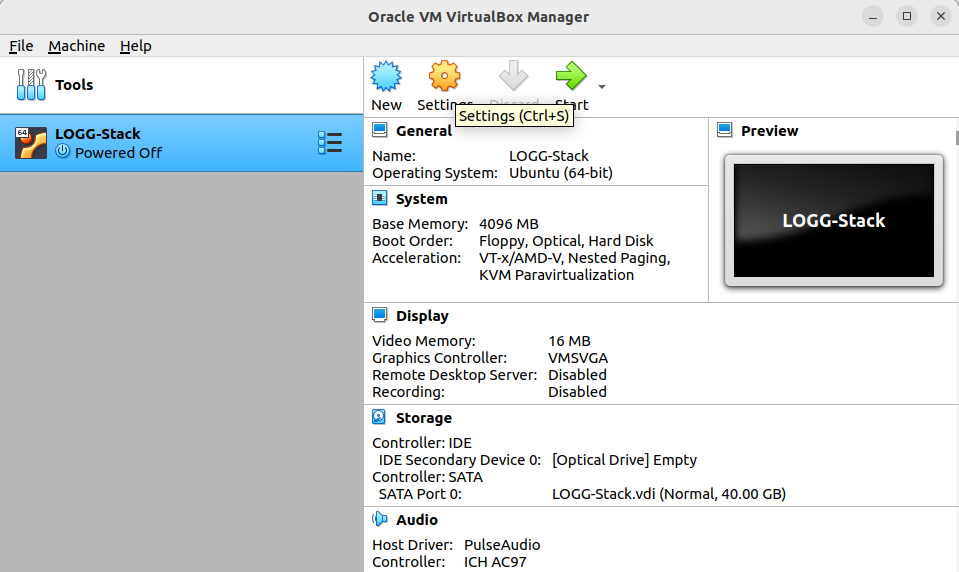
Clicking Settings will bring up the screen below.
The adjustments we need to make can be found under the System icon in the VirtualBox settings. Specifically, we'll focus on the Processor tab, where we can configure the number of CPU cores allocated to our virtual machine. The following section will guide you through these steps, as illustrated below.
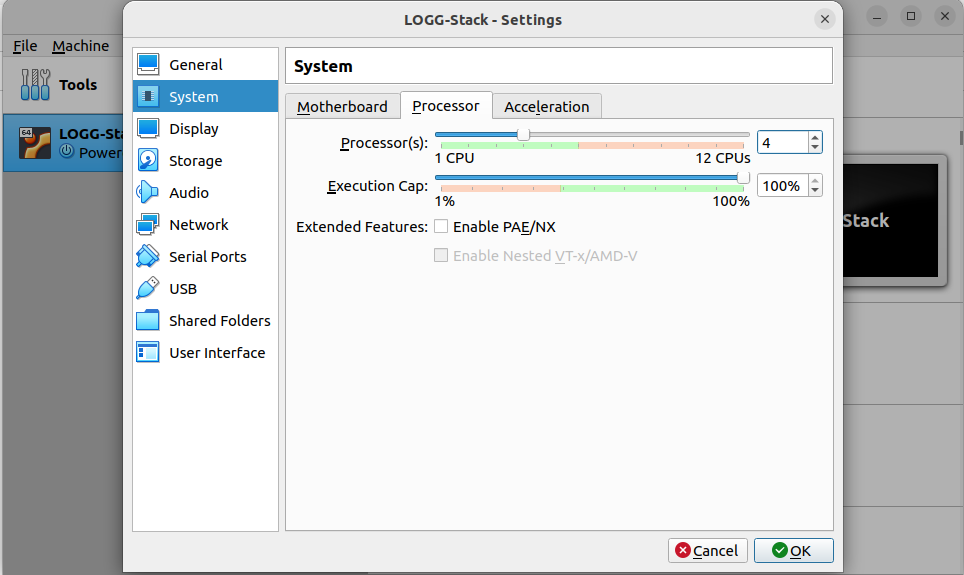
Adjust the number of CPU cores by either typing the value directly or using the slider. For this project, we're aiming to allocate 4 processor cores to ensure optimal performance. If your system has fewer cores available, you can reduce this to 2 cores, but 4 cores will provide the best results for our needs.
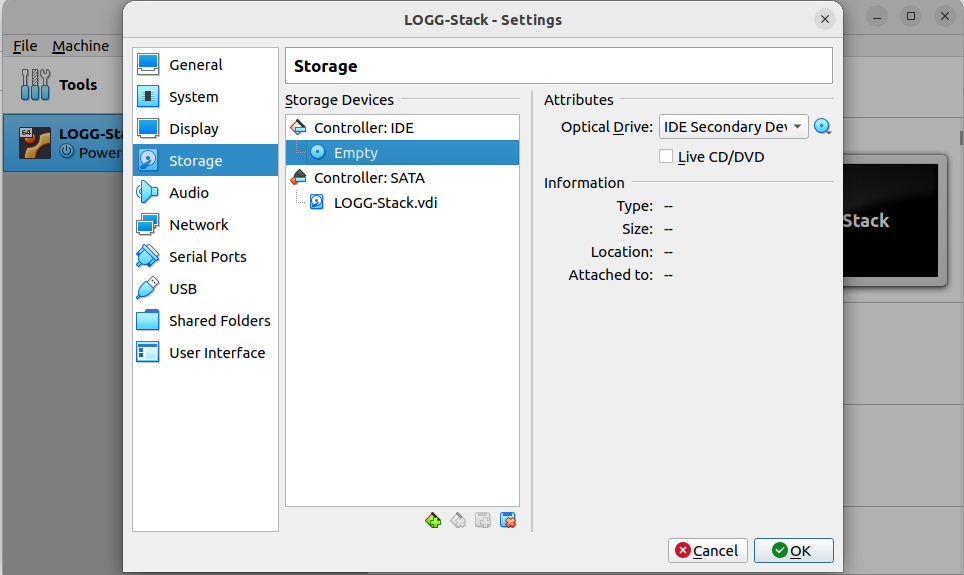
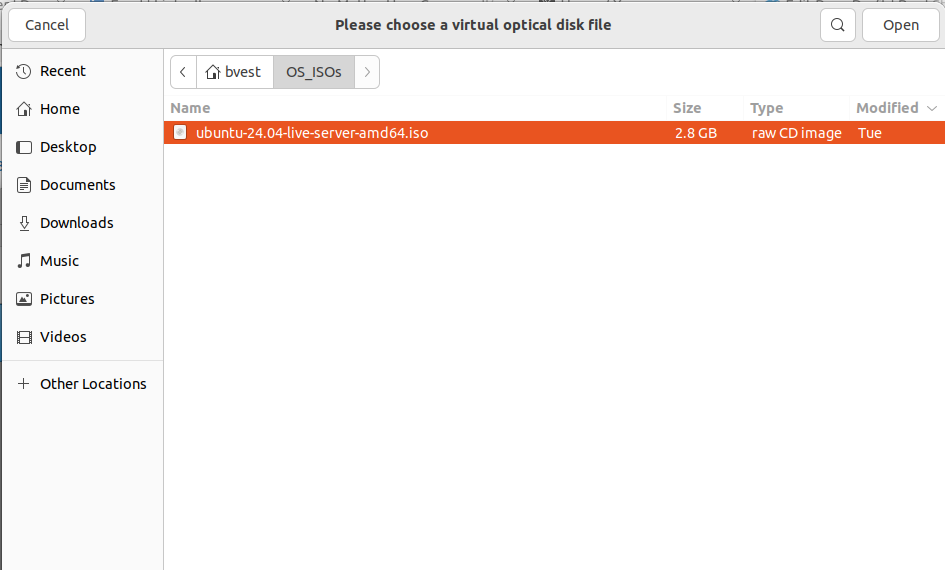
Once you're in the Storage settings, select the Empty disk option under Controller: IDE. This represents the virtual DVD drive for our VM, where we'll mount the Ubuntu ISO. Click on the small blue disk icon next to IDE Secondary Device and choose "Choose a Disk File" from the dropdown menu. This action will open a file selection window. While the appearance of this window may vary depending on your operating system, simply locate and select the Ubuntu ISO file that we downloaded earlier.
After loading the file you will be returned to the setting screen shown below.
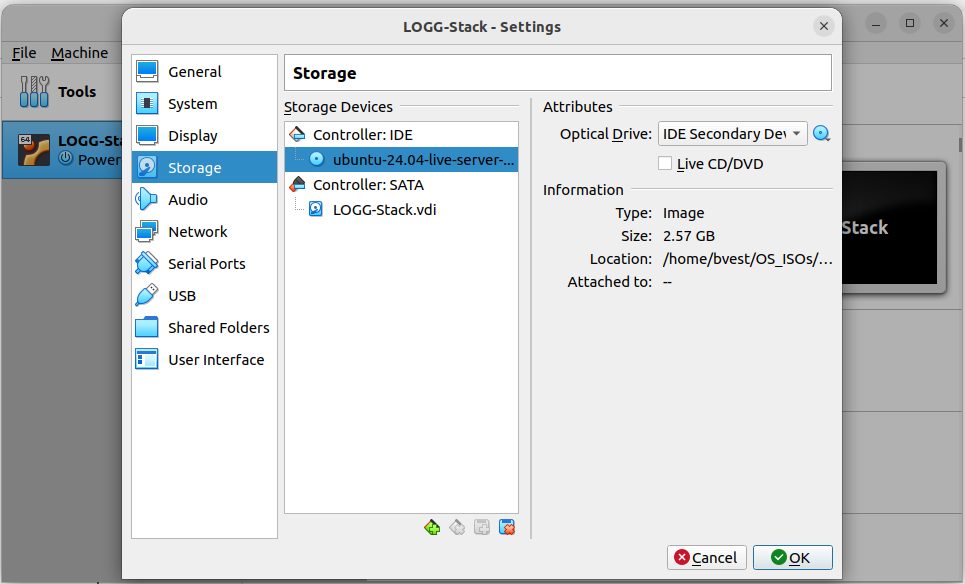
From here click OK and you will be returned back to the main virtualbox screen. You can verify your changes here in the window on the right.
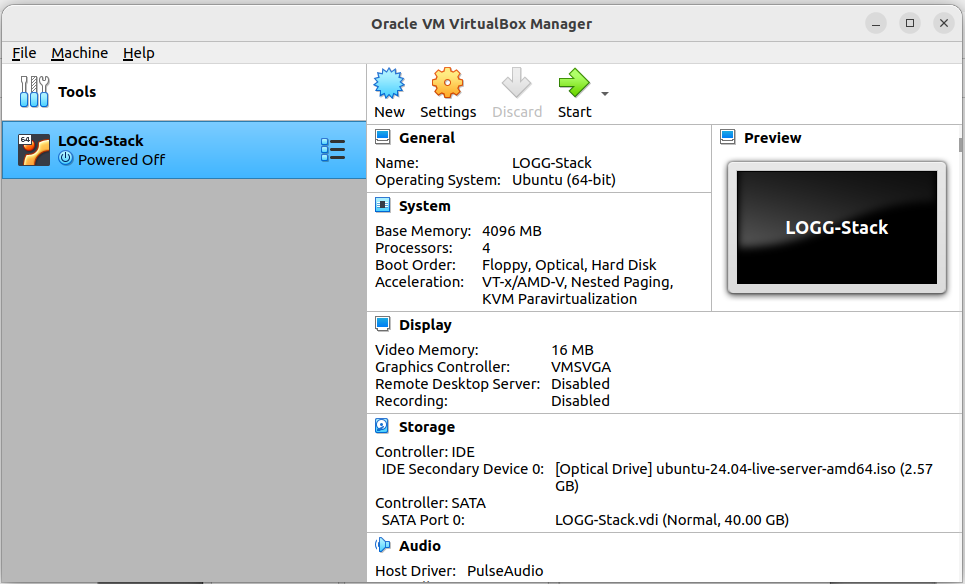
At this point, you should see that the VM is configured with 4 processors, 4096 MB of Base Memory, and that the IDE Secondary Device 0 is now set to our Linux ISO. With these configurations in place, we're ready to start the VM and begin the installation of our operating system. Follow along in Chapter 3: Installing Linux, where we will walk through the installation process step by step and explain the various options available.
Chapter 3: Installing Linux
Why Linux?
Linux, born in 1991 as a kernel project by Linus Torvalds, has grown into the backbone of countless systems around the globe, and for good reason. It’s a powerful, versatile, and open-source operating system that’s become the foundation for everything from small servers to enterprise-level applications. For our LOGG stack project, Linux is the ideal choice because of its stability, extensive community support, and flexibility.
We’re choosing Ubuntu, a distribution with a strong Debian core, known for its balance between user-friendliness and deep technical capability. Debian, which Ubuntu is built upon, has a reputation for stability and performance, making it an excellent choice for running the components of our stack. By installing Ubuntu manually via the VM terminal, you’ll gain a deep understanding of the system's architecture, preparing you to manage and troubleshoot the stack as you scale it up.
Understanding the intricacies of a Linux installation—partitioning, selecting the appropriate packages, and configuring the system—provides a foundation that goes beyond just getting things up and running. It’s about building a system that you control fully, with the ability to customize and optimize as needed. This knowledge isn’t just a checkbox on the journey to building the LOGG stack; it’s a critical skill that will empower you to handle complex technical challenges, not just in this project but in any Linux-based system you encounter in your career.